1# pprof
2
3pprof is a tool for visualization and analysis of profiling data.
4
5pprof reads a collection of profiling samples in profile.proto format and
6generates reports to visualize and help analyze the data. It can generate both
7text and graphical reports (through the use of the dot visualization package).
8
9profile.proto is a protocol buffer that describes a set of callstacks
10and symbolization information. A common usage is to represent a set of
11sampled callstacks from statistical profiling. The format is
12described on the proto/profile.proto file. For details on protocol
13buffers, see https://developers.google.com/protocol-buffers
14
15Profiles can be read from a local file, or over http. Multiple
16profiles of the same type can be aggregated or compared.
17
18If the profile samples contain machine addresses, pprof can symbolize
19them through the use of the native binutils tools (addr2line and nm).
20
21# pprof profiles
22
23pprof operates on data in the profile.proto format. Each profile is a collection
24of samples, where each sample is associated to a point in a location hierarchy,
25one or more numeric values, and a set of labels. Often these profiles represents
26data collected through statistical sampling of a program, so each sample
27describes a program call stack and a number or value of samples collected at a
28location. pprof is agnostic to the profile semantics, so other uses are
29possible. The interpretation of the reports generated by pprof depends on the
30semantics defined by the source of the profile.
31
32# Usage modes
33
34There are few different ways of using `pprof`.
35
36## Report generation
37
38If a report format is requested on the command line:
39
40 pprof <format> [options] source
41
42pprof will generate a report in the specified format and exit.
43Formats can be either text, or graphical. See below for details about
44supported formats, options, and sources.
45
46## Interactive terminal use
47
48Without a format specifier:
49
50 pprof [options] source
51
52pprof will start an interactive shell in which the user can type
53commands. Type `help` to get online help.
54
55## Web interface
56
57If a host:port is specified on the command line:
58
59 pprof -http=[host]:[port] [options] source
60
61pprof will start serving HTTP requests on the specified port. Visit
62the HTTP url corresponding to the port (typically `http://<host>:<port>/`)
63in a browser to see the interface.
64
65# Details
66
67The objective of pprof is to generate a report for a profile. The report is
68generated from a location hierarchy, which is reconstructed from the profile
69samples. Each location contains two values:
70
71* *flat*: the value of the location itself.
72* *cum*: the value of the location plus all its descendants.
73
74Samples that include a location multiple times (e.g. for recursive functions)
75are counted only once per location.
76
77## Options
78
79*options* configure the contents of a report. Each option has a value,
80which can be boolean, numeric, or strings. While only one format can
81be specified, most options can be selected independently of each
82other.
83
84Some common pprof options are:
85
86* **-flat** [default], **-cum**: Sort entries based on their flat or cumulative
87 value respectively, on text reports.
88* **-functions** [default], **-filefunctions**, **-files**, **-lines**,
89 **-addresses**: Generate the report using the specified granularity.
90* **-noinlines**: Attribute inlined functions to their first out-of-line caller.
91 For example, a command like `pprof -list foo -noinlines profile.pb.gz` can be
92 used to produce the annotated source listing attributing the metrics in the
93 inlined functions to the out-of-line calling line.
94* **-nodecount= _int_:** Maximum number of entries in the report. pprof will
95 only print this many entries and will use heuristics to select which entries
96 to trim.
97* **-focus= _regex_:** Only include samples that include a report entry matching
98 *regex*.
99* **-ignore= _regex_:** Do not include samples that include a report entry
100 matching *regex*.
101* **-show\_from= _regex_:** Do not show entries above the first one that
102 matches *regex*.
103* **-show= _regex_:** Only show entries that match *regex*.
104* **-hide= _regex_:** Do not show entries that match *regex*.
105
106Each sample in a profile may include multiple values, representing different
107entities associated to the sample. pprof reports include a single sample value,
108which by convention is the last one specified in the report. The `sample_index=`
109option selects which value to use, and can be set to a number (from 0 to the
110number of values - 1) or the name of the sample value.
111
112Sample values are numeric values associated to a unit. If pprof can recognize
113these units, it will attempt to scale the values to a suitable unit for
114visualization. The `unit=` option will force the use of a specific unit. For
115example, `unit=sec` will force any time values to be reported in
116seconds. pprof recognizes most common time and memory size units.
117
118## Tags
119
120Samples in a profile may have tags. These tags have a name and a value. The
121value can be either numeric or a string; the numeric values can be associated
122with a unit. Tags are used as additional dimensions that the sample values can
123be broken by. The most common use of tags is selecting samples from a profile
124based on the tag values. pprof also supports tags at the visualization time.
125
126### Tag filtering
127
128The `-tagfocus` option is the most used option for selecting data in a profile
129based on tag values. It has the syntax of **-tagfocus=_regex_** or
130**-tagfocus=_range_:** which will restrict the data to samples with tags matched
131by regexp or in range. The `-tagignore` option has the identical syntax and can
132be used to filter out the samples that have matching tags. If both `-tagignore`
133and `-tagfocus` are specified and match a given sample, then the sample will be
134discarded.
135
136When using `-tagfocus=regex` and `-tagignore=regex`, the regex will be compared
137to each value associated with each tag. If one specifies a value
138like `regex1,regex2`, then only samples with a tag value matching `regex1`
139and a tag value matching `regex2` will be kept.
140
141In addition to being able to filter on tag values, one can specify the name of
142the tag which a certain value must be associated with using the notation
143`-tagfocus=tagName=value`. Here, the `tagName` must match the tag's name
144exactly, and the value can be either a regex or a range. If one specifies
145a value like `regex1,regex2`, then samples with a tag value (paired with the
146specified tag name) matching either `regex1` or matching `regex2` will match.
147
148Here are examples explaining how `-tagfocus` can be used:
149
150* `-tagfocus 128kb:512kb` accepts a sample iff it has any numeric tag with
151 memory value in the specified range.
152* `-tagfocus mytag=128kb:512kb` accepts a sample iff it has a numeric tag
153 `mytag` with memory value in the specified range. There isn't a way to say
154 `-tagfocus mytag=128kb:512kb,16kb:32kb`
155 or `-tagfocus mytag=128kb:512kb,mytag2=128kb:512kb`. Just single value or
156 range for numeric tags.
157* `-tagfocus someregex` accepts a sample iff it has any string tag with
158 `tagName:tagValue` string matching specified regexp. In the future, this
159 will change to accept sample iff it has any string tag with `tagValue` string
160 matching specified regexp.
161* `-tagfocus mytag=myvalue1,myvalue2` matches if either of the two tag values
162 are present.
163
164### Tag visualization
165
166To list the tags and their values available in a profile use **-tags** option.
167It will output the available tags and their values as well as the breakdown of
168the sample value by the values of each tag.
169
170The pprof callgraph reports, such as `-web` or raw `-dot`, will automatically
171visualize the values for all tags as pseudo nodes in the graph. Use `-tagshow`
172and `-taghide` options to limit what tags are displayed. The options accept a
173regular expression that is matched against the tag name to show or hide it
174respectively.
175
176Options `-tagroot` and `-tagleaf` can be used to create pseudo stack frames to
177the profile samples. For example, `-tagroot=mytag` will add stack frames at the
178root of the profile call tree with the value of the tag for the corresponding
179samples. Similarly, `-tagleaf=mytag` will add such stack frames as leaf nodes of
180each sample. These options are useful when visualizing a profile in tree formats
181such as the tree view in the `-http` mode web UI.
182
183## Text reports
184
185pprof text reports show the location hierarchy in text format.
186
187* **-text:** Prints the location entries, one per line, including the flat and
188 cum values.
189* **-tree:** Prints each location entry with its predecessors and successors.
190* **-peek= _regex_:** Print the location entry with all its predecessors and
191 successors, without trimming any entries.
192* **-traces:** Prints each sample with a location per line.
193
194## Graphical reports
195
196pprof can generate graphical reports on the DOT format, and convert them to
197multiple formats using the graphviz package.
198
199These reports represent the location hierarchy as a graph, with a report entry
200represented as a node. Nodes are removed using heuristics to limit the size of
201the graph, controlled by the *nodecount* option.
202
203* **-dot:** Generates a report in .dot format. All other formats are generated
204 from this one.
205* **-svg:** Generates a report in SVG format.
206* **-web:** Generates a report in SVG format on a temp file, and starts a web
207 browser to view it.
208* **-png, -jpg, -gif, -pdf:** Generates a report in these formats.
209
210### Interpreting the Callgraph
211
212* **Node Color**:
213 * large positive cum values are red.
214 * large negative cum values are green; negative values are most likely to
215 appear during profile comparison, see [this section](#comparing-profiles)
216 for details.
217 * cum values close to zero are grey.
218
219* **Node Font Size**:
220 * larger font size means larger absolute flat values.
221 * smaller font size means smaller absolute flat values.
222
223* **Edge Weight**:
224 * thicker edges indicate more resources were used along that path.
225 * thinner edges indicate fewer resources were used along that path.
226
227* **Edge Color**:
228 * large positive values are red.
229 * large negative values are green.
230 * values close to zero are grey.
231
232* **Dashed Edges**: some locations between the two connected locations were
233 removed.
234
235* **Solid Edges**: one location directly calls the other.
236
237* **"(inline)" Edge Marker**: the call has been inlined into the caller.
238
239Let's consider the following example graph:
240
241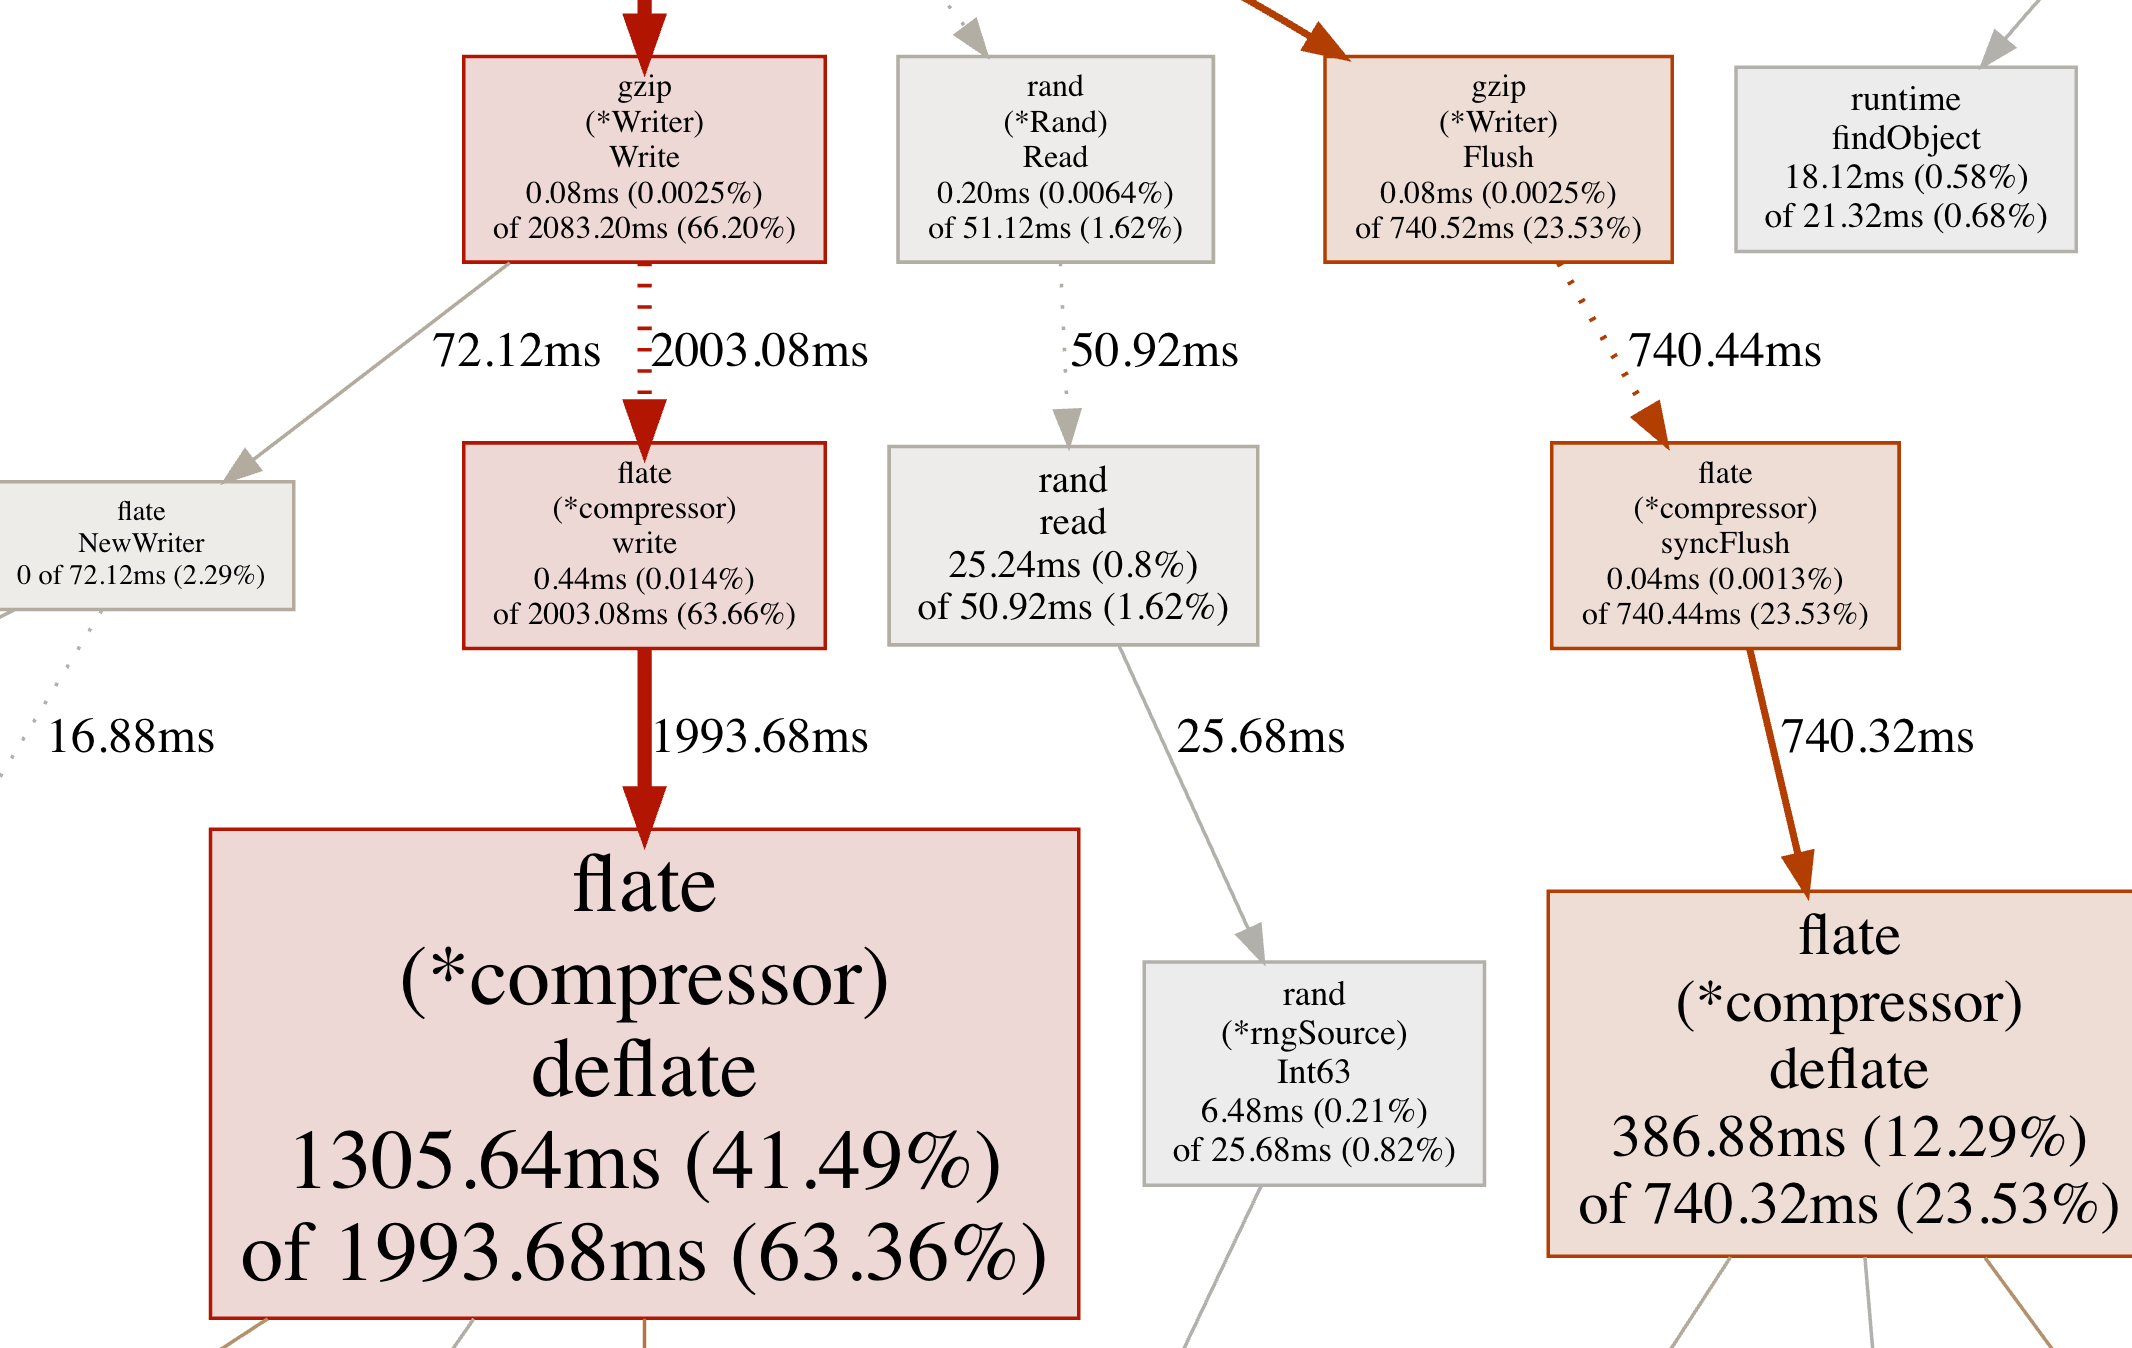
242
243* For nodes:
244 * `(*Rand).Read` has a small flat value and a small cum value because the
245 the font is small and the node is grey.
246 * `(*compressor).deflate` has a large flat value and a large cum value because the font
247 is large and the node is red.
248 * `(*Writer).Flush` has a small flat value and a large cum value because the font is
249 small and the node is red.
250
251* For edges:
252 * the edge between `(*Writer).Write` and `(*compressor).write`:
253 * Since it is a dashed edge, some nodes were removed between those two.
254 * Since it is thick and red, more resources were used in call stacks between
255 those two nodes.
256 * the edge between `(*Rand).Read` and `read`:
257 * Since it is a dashed edge, some nodes were removed between those two.
258 * Since it is thin and grey, fewer resources were used in call stacks
259 between those two nodes.
260 * the edge between `read` and `(*rngSource).Int63`:
261 * Since it is a solid edge, there are no nodes between those two (i.e. it
262 was a direct call).
263 * Since it is thin and grey, fewer resources were used in call stacks
264 between those two nodes.
265
266## Annotated code
267
268pprof can also generate reports of annotated source with samples associated to
269them. For these, the source or binaries must be locally available, and the
270profile must contain data with the appropriate level of detail.
271
272pprof will look for source files on its current working directory and all its
273ancestors. pprof will look for binaries on the directories specified in the
274`$PPROF_BINARY_PATH` environment variable, by default `$HOME/pprof/binaries`
275(`%USERPROFILE%\pprof\binaries` on Windows). It will look binaries up by name,
276and if the profile includes linker build ids, it will also search for them in
277a directory named as the build id.
278
279pprof uses the binutils tools to examine and disassemble the binaries. By
280default it will search for those tools in the current path, but it can also
281search for them in a directory pointed to by the environment variable
282`$PPROF_TOOLS`.
283
284* **-list= _regex_:** Generates an annotated source listing for functions
285 matching *regex*, with flat/cum values for each source line.
286* **-disasm= _regex_:** Generates an annotated disassembly listing for
287 functions matching *regex*.
288* **-weblist= _regex_:** Generates a source/assembly combined annotated listing
289 for functions matching *regex*, and starts a web browser to display it.
290
291## Comparing profiles
292
293pprof can subtract one profile from another, provided the profiles are of
294compatible types (i.e. two heap profiles). pprof has two options which can be
295used to specify the filename or URL for a profile to be subtracted from the
296source profile:
297
298* **-diff_base= _profile_:** useful for comparing two profiles. Percentages in
299the output are relative to the total of samples in the diff base profile.
300
301* **-base= _profile_:** useful for subtracting a cumulative profile, like a
302[golang block profile](https://golang.org/doc/diagnostics.html#profiling),
303from another cumulative profile collected from the same program at a later time.
304When comparing cumulative profiles collected on the same program, percentages in
305the output are relative to the difference between the total for the source
306profile and the total for the base profile.
307
308The **-normalize** flag can be used when a base profile is specified with either
309the `-diff_base` or the `-base` option. This flag scales the source profile so
310that the total of samples in the source profile is equal to the total of samples
311in the base profile prior to subtracting the base profile from the source
312profile. Useful for determining the relative differences between profiles, for
313example, which profile has a larger percentage of CPU time used in a particular
314function.
315
316When using the **-diff_base** option, some report entries may have negative
317values. If the merged profile is output as a protocol buffer, all samples in the
318diff base profile will have a label with the key "pprof::base" and a value of
319"true". If pprof is then used to look at the merged profile, it will behave as
320if separate source and base profiles were passed in.
321
322When using the **-base** option to subtract one cumulative profile from another
323collected on the same program at a later time, percentages will be relative to
324the difference between the total for the source profile and the total for
325the base profile, and all values will be positive. In the general case, some
326report entries may have negative values and percentages will be relative to the
327total of the absolute value of all samples when aggregated at the address level.
328
329# Fetching profiles
330
331pprof can read profiles from a file or directly from a URL over http or https.
332Its native format is a gzipped profile.proto file, but it can
333also accept some legacy formats generated by
334[gperftools](https://github.com/gperftools/gperftools).
335
336When fetching from a URL handler, pprof accepts options to indicate how much to
337wait for the profile.
338
339* **-seconds= _int_:** Makes pprof request for a profile with the specified
340 duration in seconds. Only makes sense for profiles based on elapsed time, such
341 as CPU profiles.
342* **-timeout= _int_:** Makes pprof wait for the specified timeout when
343 retrieving a profile over http. If not specified, pprof will use heuristics to
344 determine a reasonable timeout.
345
346pprof also accepts options which allow a user to specify TLS certificates to
347use when fetching or symbolizing a profile from a protected endpoint. For more
348information about generating these certificates, see
349https://docs.docker.com/engine/security/https/.
350
351* **-tls\_cert= _/path/to/cert_:** File containing the TLS client certificate
352 to be used when fetching and symbolizing profiles.
353* **-tls\_key= _/path/to/key_:** File containing the TLS private key to be used
354 when fetching and symbolizing profiles.
355* **-tls\_ca= _/path/to/ca_:** File containing the certificate authority to be
356 used when fetching and symbolizing profiles.
357
358pprof also supports skipping verification of the server's certificate chain and
359host name when collecting or symbolizing a profile. To skip this verification,
360use "https+insecure" in place of "https" in the URL.
361
362If multiple profiles are specified, pprof will fetch them all and merge
363them. This is useful to combine profiles from multiple processes of a
364distributed job. The profiles may be from different programs but must be
365compatible (for example, CPU profiles cannot be combined with heap profiles).
366
367## Symbolization
368
369pprof can add symbol information to a profile that was collected only with
370address information. This is useful for profiles for compiled languages, where
371it may not be easy or even possible for the profile source to include function
372names or source coordinates.
373
374pprof can extract the symbol information locally by examining the binaries using
375the binutils tools, or it can ask running jobs that provide a symbolization
376interface.
377
378pprof will attempt symbolizing profiles by default, and its `-symbolize` option
379provides some control over symbolization:
380
381* **-symbolize=none:** Disables any symbolization from pprof.
382
383* **-symbolize=local:** Only attempts symbolizing the profile from local
384 binaries using the binutils tools.
385
386* **-symbolize=remote:** Only attempts to symbolize running jobs by contacting
387 their symbolization handler.
388
389For local symbolization, pprof will look for the binaries on the paths specified
390by the profile, and then it will search for them on the path specified by the
391environment variable `$PPROF_BINARY_PATH`. Also, the name of the main binary can
392be passed directly to pprof as its first parameter, to override the name or
393location of the main binary of the profile, like this:
394
395 pprof /path/to/binary profile.pb.gz
396
397By default pprof will attempt to demangle and simplify C++ names, to provide
398readable names for C++ symbols. It will aggressively discard template and
399function parameters. This can be controlled with the `-symbolize=demangle`
400option. Note that for remote symbolization mangled names may not be provided by
401the symbolization handler.
402
403* **-symbolize=demangle=none:** Do not perform any demangling. Show mangled
404 names if available.
405
406* **-symbolize=demangle=full:** Demangle, but do not perform any
407 simplification. Show full demangled names if available.
408
409* **-symbolize=demangle=templates:** Demangle, and trim function parameters, but
410 not template parameters.
411
412# Web Interface
413
414When the user requests a web interface (by supplying an `-http=[host]:[port]`
415argument on the command-line), pprof starts a web server and opens a browser
416window pointing at that server. The web interface provided by the server allows
417the user to interactively view profile data in multiple formats.
418
419## Views
420
421The top of the display is a header that contains some buttons and menus. The
422`View` menu allows the user to switch between different visualizations of the
423profile. The available views are described here:
424
425### Graph
426
427The default view in the local web interface displays a graph where the nodes are
428functions, and edges indicate caller/callee relations.
429
430Note: You can drag the display around with the mouse button held down, or zoom
431in and out using a mouse scroll-wheel or pinch/expand touch gestures.
432
433
434
435E.g., `FormatPack` has an outgoing edge to `FormatUntyped` that indicates that
436the former calls the latter. The number along the edge (5.72s) indicates the
437amount of time that was spent in `FormatUntyped` (and its callees) when called
438from `FormatPack`.
439
440See [earlier explanation](#interpreting-the-callgraph) for more details.
441
442### Flame graph
443
444Switching to the `Flame graph` view (via the `View` menu) will display a [flame
445graph](https://www.brendangregg.com/flamegraphs.html). This view provides a
446compact representation of caller/callee relations:
447
448
449
450Boxes on this view correspond to stack frames in the profile. Caller boxes are
451directly above callee boxes. The width of each box is proportional to the sum of
452the sample value of profile samples where that frame was present on the call
453stack. Children of a particular box are laid out left to right in decreasing
454size order.
455
456E.g., here we see that `FormatPack` is right above `FormatUntyped`, which
457indicates that the former calls the latter. The width of `FormatUntyped`
458corresponds to the fraction of time accounted for by this call.
459
460Names displayed in different boxes may have different font sizes. These size
461differences are due to an attempt to fit as much of the name into the box as
462possible; no other interpretation should be placed on the size.
463
464Boxes are colored according to the name of the package in which the corresponding
465function occurs. E.g., in C++ profiles all frames corresponding to `std::` functions
466will be assigned the same color.
467
468#### Viewing callers
469
470Traditional flame graphs provide a top-down view: it is easy to see the
471functions called by a particular function, but harder to find callers of a
472particular function. E.g., in the linked example there are multiple occurrences
473of `FormatUntyped` since it has multiple callers.
474
475Pprof's flame graph extend the traditional model: when a function is selected,
476the graph changes to show call-stacks leading that function. Therefore, clicking
477on any of the `FormatUntyped` boxes will show the call stacks that end up
478calling `FormatUntyped`:
479
480
481
482#### Diff mode
483
484When using the **--diff_base** option, box width is proportional to the sum of
485the increases and decreases in the sub-tree rooted at box. E.g., if the cost of
486one child of box decreases by 150 and the cost of another child increases by
487200, the box width will be proportional to 150+200. The net increase or decrease
488(the preceding example has a net increase of 200-150, i.e., 50) is indicated by
489a shaded region. The size of the shaded region is proportional to the net
490increase or net decrease. The shading is red for a net increase, and green for a
491net decrease.
492
493#### Inlining
494
495Inlining is indicated by the absence of a horizontal border between a caller and
496a callee. E.g., suppose X calls Y calls Z and the call from Y to Z is inlined into
497Y. There will be a black border between X and Y, but no border between Y and Z.
498
499### Annotated Source Code
500
501Let's try to dig into what is going on inside `FormatUntyped` by viewing its
502source-code annotated with performance data. First, right-click on the box for
503the function to get a context menu.
504
505
506
507Select `Show source in new tab`. That will create a new tab that displays source
508code for the function.
509
510Note: You can also display source code by selecting `Source` from the `View`
511menu, but only do so if you are focused on just one or a few routines since
512source code display can be very slow and voluminous when multiple functions are
513being viewed.
514
515
516
517Each source line is annotated with the time spent in that source line. There are
518two numbers (e.g., 840ms and 6.17s on line 207 in the screenshot). The first
519number does not count time spent in functions called from the source line, the
520second number includes that time.
521
522Let's dig down a bit more by clicking on line 207. That will expand the display
523to include the source code for inlined function calls, as well as the
524corresponding assembly code.
525
526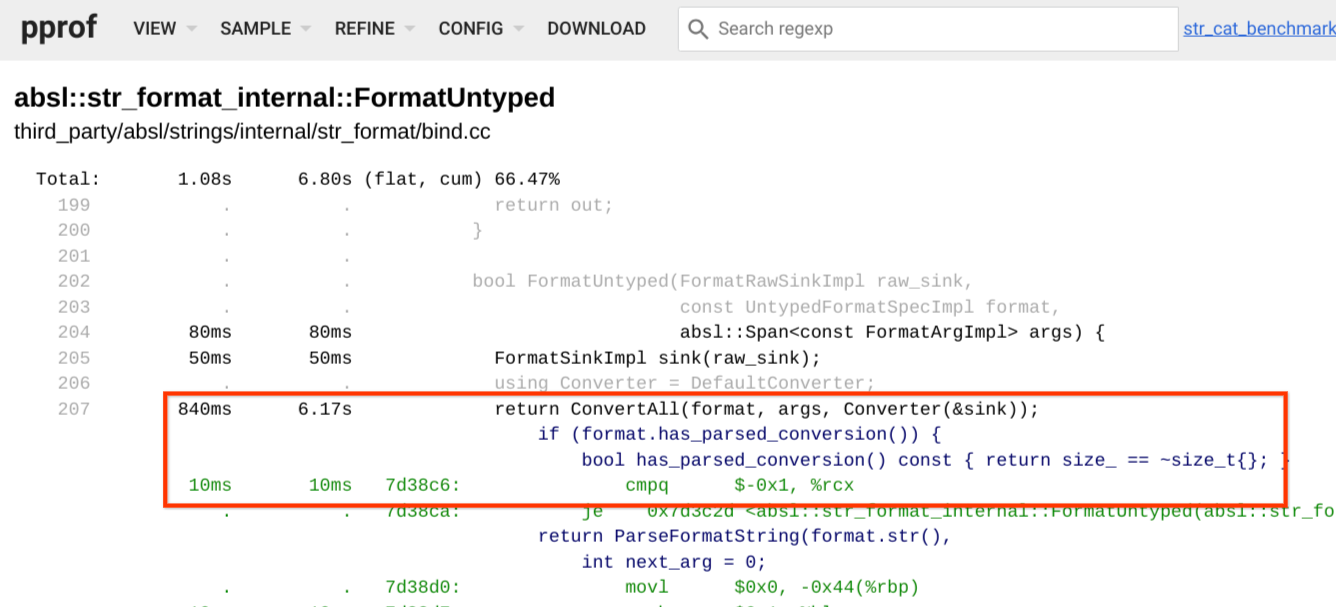
527
528The assembly code is displayed in green. Source code for inlined functions is
529displayed in blue and is indented by its inlining level. For example, the
530indentation indicates that the `ConvertAll` call on line 207 is inlined, and it
531in turn has an inlined call to `has_parsed_conversion`, which in turn expands to
532a `cmpq` instruction.
533
534### Disassembly
535
536Sometimes it is helpful to view just the disassembly in instruction order
537without interleaving with source code. You can achieve this by selecting
538`Disassemble`" from the `View` menu.
539
540Note: Do not select `Disassemble` unless you are focused on just one or a few
541routines since disassembly can be very slow and voluminous when multiple
542functions are being viewed.
543
544
545
546### Top Functions
547
548You may sometimes find a table that displays just the top functions in the
549profile helpful.
550
551
552
553The table shows numbers (and percentages) for two different metrics:
554
555* `flat`: profile samples in this function
556* `cum`: (cumulative) profile samples in this function and its callees
557
558The table is initially sorted in decreasing order of `flat`. Clicking on the
559`Cum` table header will sort it in decreasing order of samples in the function
560and its callees.
561
562### Peek
563
564This view shows callers / callees per function in a simple textual format.
565The Flame graph view is typically more helpful.
566
567## Config
568
569The `Config` menu allows the user to save the current refinement
570settings (e.g., the focus and hide list) as a named configuration. A
571saved configuration can later be re-applied to reinstitue the saved
572refinements. The `Config` menu contains:
573
574**Save as ...**: shows a dialog where the user can type in a
575configuration name. The current refinement settings are saved under
576the specified name.
577
578**Default**: switches back to the default view by removing all refinements.
579
580The `Config` menu also contains an entry per named
581configuration. Selecting such an entry applies that configuration. The
582currently selected entry is marked with a ✓. Clicking on the 🗙 on the
583right-hand side of such an entry deletes the configuration (after
584prompting the user to confirm).
585
586## TODO: cover the following issues:
587
588* Overall layout
589* Other menu entries
View as plain text